

This book is a really great one relates to visual thinking. As I always worked as the visual sketcher of the group in last semester, the content in this book attracts me a lot in the first eye. Before I come here, the study back home does not advocate visual elements especially in industry design because the academic didn’t want us focus much on them but more on the structure and function elements of products. However, the study in UK provides me lots insights of how visual thinking could help express and generate meaningful ideas.
Before I forget anything, this blog is a good space to place some notes of this book.
Firstly, the author (Dan Roam) introduces The six problem “clumps”.

They are quite familiar to us design students because they are just the famous Ws. But in this book I could see more roles they play in the design process. In the later chapter while the author talking about visual thinking these six problems repeat a lot as important elements of all complex issues.
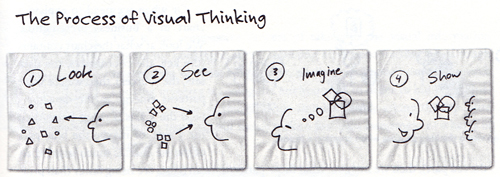
Then here is the introduction of The process of visual thinking. These steps look quite simple but through the real business cases the author proves how they work well in different contexts. What I could find very useful here is that the “Show” step is actually the last step of visual thinking. That means we don’t need and shouldn’t focus too much on the show problem in the earlier stage. It’s true that design students are more disposed to think more about how to show to clients before anything had happened but as critical thinker we should try best to avoid it and follow the right flow in case of the loss of the real valuable information.
Next The four cardinal rules for better looking is also familiar to me especially after experiencing the study in the last semester. Collect everything you can and lay it all out where you can look at it, and then establish fundamental coordinates (analyze) and finally practice visual triage. The whole process is just like the project we did in our MDes Studio. The most different thing I could find here is the coordinates step. And I still think it may be more and more approaches to analyze the data (maybe the strategic information design Module could give me more answers about this part) but for business use these four steps for looking should be enough.

Then there are sentences in this book really enlighten me which are
“One of the most important virtues of visual thinking is its ability to clarify things so that the complex can be better understood, but does not mean that all good visual thinking is about simplification.”
“The real good of visual thinking is to make the complex understandable by making it visible- not by making it simple.”
I still remember that the service designer of 21th century should be: Mediator of stakeholders; navigator of complexity; communicator of value; facilitator of thinking; visualizer of intangibles; and integrator of concepts. And this book successfully links the rule of navigator of complexity of service designers to visual thinking and simple sketches. It reminds me that the real purpose of visual thinking.
Then there is very interesting concept of <6><6> module. The see steps relate to the six problems the author mentioned in the first chapter of this book and this module transfers the see step to show step in a clear way. Still, I believe that we could create many more appropriate approaches to show the final result, which need to be well designed. But the six show ways mentioned in this book are enough for most business issues. Besides, the author mentions that there could be combinations among the graphs, which I believe must happen a lot in the real world. Therefore there may be much much more possibilities of the results of see step and all of them should depend on various contexts of the projects.
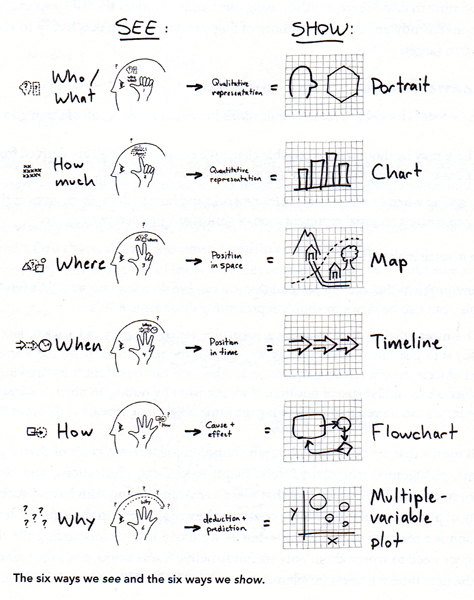
Then the author introduces S.Q.V.I.D. It represents different two aspects of how we see different issues and when combined to <6><6> module it turns to be The visual thinking codex:

From the big table, it’s clear that our author uses a very strategic method to progress visual thinking. This codex, as the author said, almost contains all business issues in the real life. We could choose one or more problems from the <6><6> module firstly and then consider the S.Q.V.I.D to find the best graph to show. Therefore if we followed the author’s steps in visual thinking, the final show result will appear automatically and followed a very critical consideration. What we need to do is to make it clear of what to do in different steps of the whole process and then we could get the best result of it. I know it will be much more complex when we need to deal with any real issues in projects because it’s just too difficult to make anything clear and it must contains lots of evaluation when we choose anything. For me, this book is not the final guidebook I will follow in the future but great inspiration of visual thinking: I need to generate my own process, keep it simple and clear, make full use of visual elements but should not forget their real functions.
